free html hit counter Peak Oil Debunked: April 2006

Sunday, April 30, 2006

298. RESERVE GROWTH

There was a bit of confusion regarding the previous post (#297), so let me shed some light with a simple calculation.

Turning again to the BP Statistical Review, we obtain the following figures:

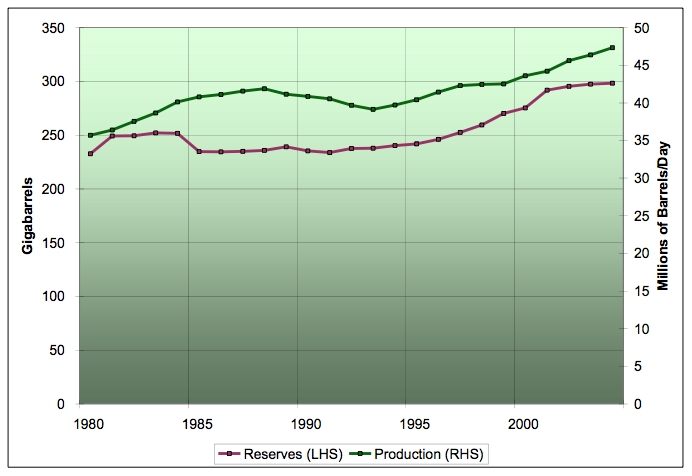
World oil reserves in 1980: 667Gb
World oil reserves in 2004: 1189Gb
Word oil production 1980-2004: 609Gb

Now, I have also previously transcribed Colin Campbell's "Growing Gap" graph of discovery (Feb. 2006 version):
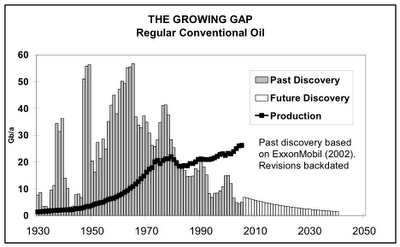
The "Growing Gap"

From this graph, we can derive total world discovery for the period 1980-2004:

World oil discovery 1980-2004: 339Gb

So let's do the calculation. We start in 1980 with 667Gb of reserves in the world. Over the course of 24 years (1980-2004), we pump out 609Gb of that, leaving us with 58Gb. To that we add the amount discovered in the period 1980-2004 (i.e. 339Gb), giving us a total of 397Gb in 2004.

Clearly, something has gone seriously haywire because the actual reserves in 2004 are 1189Gb, i.e. 792Gb more than we should have if discovery is the only way to increase reserves. That's a massive discrepancy roughly equal to 4 Saudi Arabias, or 66 Prudhoe Bays. So, all you peak oil geniuses out there, where did it come from? It could not have come from discovery.

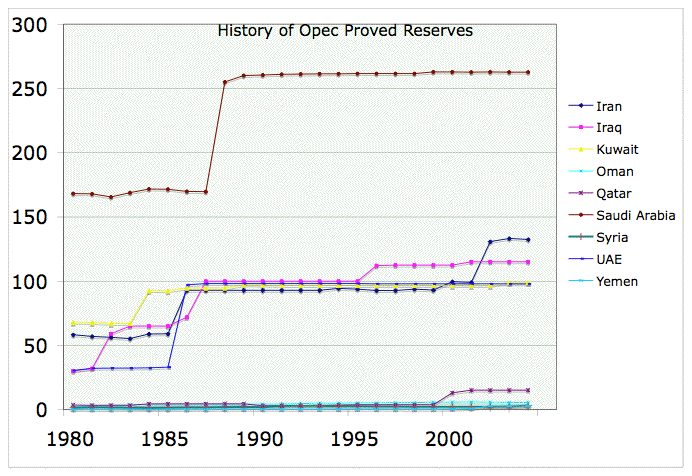
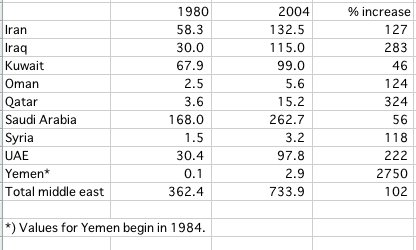
Spurious additions to OPEC reserves won't explain it. OPEC reserves only increased by 456Gb from 1980 to 2004, so that still leaves us with 336Gb unaccounted for. That's 28 Prudhoe Bays which somehow got added to world reserves between 1980-2004, without being discovered. Where did that 336Gb come from?

We saw this same phenomenon at work in 239. GHAWAR NOW EMPTY. We have already pumped more oil out of Ghawar than the 1975 estimate of Ghawar's ultimately recoverable reserves (URR), according to data from Matt Simmons himself. So how do you explain that? Did the reserves in Ghawar somehow grow without any new discovery taking place? It definitely seems that they did. But if the reserves of Ghawar can grow without new discovery, why can't other OPEC oil fields grow in the same way? Why is it so outrageous to think that OPEC reserves can grow given that we are forced by the facts (as given by Matt Simmons) to admit that the reserves in Ghawar have grown?

Now, it's true that OPEC updates its reserves figures in an unorthodox way, and the additions seem fishy on the face of it. Nevertheless, it is silly to think that OPEC reserves do not grow, even though non-OPEC reserves world-wide do so. If OPEC reserves do not grow, then the reserves of Ghawar have not grown since 1975. Ghawar is now completely pumped out, as I have previously shown, and we are all already dead from the cataclysmic repercussions of that event.
-- by JD

Saturday, April 29, 2006

297. HOW ABOUT THOSE ANOMALOUS INCREASES IN OPEC RESERVES?

Another cornerstone of peak oil theory is the so-called "anomalous increases" in OPEC reserves in the 1980's. Here's some standard peak oiler boilerplate on the topic from the ASPO March 2004 Newsletter:
Unreliable OPEC Reserves and Upgrading the Depletion Model
The spurious nature of the reserves reported by the major OPEC countries has long been obvious. The early numbers were evidently too low, having been inherited from the foreign companies before they were expropriated. Nothing particular happened in the oilfields in the late 1980s to justify the huge increase, and in any event the valid revisions should be backdated to the discovery of the fields concerned which had been found as much as fifty years before. The increases were almost certainly prompted by OPEC quota considerations, and have barely changed since, suggesting that subsequent production has not been deducted.Source
Here's Savinar parroting the party line:
During the late 1980s, several OPEC countries drastically increased their reported oil reserves even though they had no major oil discoveries. How is that possible? The answer probably has something to do with the fact an individual OPEC member’s quotas are proportional to their proven reserves. The more they report in reserves, the more they are allowed to export, which means the more money they make. Thus, they have a huge incentive to report "reserve growth." (Source: "The Oil Age is Over" by Matt Savinar)
A nice graphic by Stuart at the Oil Drum showing the situation:
Stuart's comments on the situation:
Note that OPEC production quotas are in part dependent on proved reserves - giving these countries an incentive to exaggerate. The huge jumps in reserves were not associated with the discovery of any particular large new fields. These time series are extremely implausible on their face and suggest mendacity.
In a nutshell, the peak oilers are saying the OPEC countries are lying. They fraudulently inflated their reserves to expand their production during the "quota wars" of the 1980s.

Halfin from the Oil Drum, however, has an excellent rebuttal to this argument which needs to be brought to the forefront. To see what he is talking about, let's look at the status of non-OPEC* reserves over time from the BP Statistical Review of World Energy (graph by Stuart at the Oil Drum):
Non-OPEC countries have no incentive to exaggerate their reserves to secure larger quotas, and yet look at the reserve growth. Non-OPEC reserves grew by about 28% from 1980 to 2004. Even more astounding is this. Working from the BP figures, we find that in 1980, the non-OPEC countries had 232.5Gb of reserves, and in 2004 they had 298.2Gb of reserves. In the period from 1980 to 2004, the non-OPEC countries produced 376Gb of oil. This means that, over 24 years, the non-OPEC countries produced 160% of the reserves they had in 1980, and still ended up with 30% more reserves than they started out with it. So Campbell's point that the OPEC reserves "have barely changed since, suggesting that subsequent production has not been deducted" is obviously a crock. If we simply deducted non-OPEC production over 1980-2004 from non-OPEC reserves in 1980, non-OPEC would currently have reserves of -143.5Gb. The actual value is +298.2Gb, so (as I said) Campbell's criticism is a crock.

Massive reserve increases, despite constant production, are nothing unusual in the non-OPEC world. Here's some miscellaneous reserve increases from various countries over the period 1980-2004 (from the BP statistical review, referenced above):

Canada: 8.7Gb(1980) => 16.8(2004) = 93% increase
Brazil: 1.3Gb(1980) => 11.2(2004) = 761% increase
South/Central America minus Venezula: 7.3Gb(1980) => 24Gb(2004) = 229% increase
Norway: 3.6Gb(1980) => 9.7Gb(2004) = 169% increase
Angola: 1.4Gb(1980) => 8.8Gb(2004) = 529% increase
Asia Pacific minus Indonesia: 22.2Gb(1980) => 36.4Gb(2004) = 64% increase

Compare this with the reserve figures and increases which are supposedly anomalous:

One example should suffice to demonstrate the underlying principle. Norway in 1980 had 3Gb of reserves, and by 2004 this had increased to 9.7Gb, an increase of 169%. Meanwhile, in the period from 1980 to 2004, Norway produced 18Gb of oil -- 6 times more oil than they had in reserves in 1980. So what is so surprising about a doubling of Middle East reserves, despite constant production, over the same period? Norway wasn't involved in any "quota wars". Why do peak oilers assume that Middle East reserves should have remained constant or declined over that time, while Norway's didn't? After all, the Middle East is where, we all admit, most of the remaining conventional oil exists.

The bottom line: Increases in OPEC reserves aren't anomalous at all, and are perfectly consistent with reserve trends worldwide.
-----
*) Here I am deviating from the nomenclature in the BP review, and using the term non-OPEC to refer to all countries outside of OPEC, including the former Soviet Union (FSU).
-- by JD

Thursday, April 27, 2006

296. MORE DATA REFUTING RELOCALIZATION

As we've discussed in two previous articles (55. WILL PEAK OIL MAKE LONG DISTANCE SHIPPING TOO EXPENSIVE TO CONTINUE? and 129. WHERE'S THE RELOCALIZATION?), Kunstler and other peak oil "experts" frequently claim that expensive oil will make long-distance transport too expensive to continue. This, in turn, will cause a process called "relocalization" where people will have to produce all their food and consumer products from their own local area. Because they buy into this argument, many peak oil chicken littles are running for the hills, and frenetically trying to get up to speed on Amish topics like how to sew, raise chickens, can vegetables, make their own shoes etc. etc.

Not that there's anything wrong with that. If you like the 1850 lifestyle, knock yourself out. But please don't deceive yourself that peak oil will force relocalization to occur. It won't.

Here's yet another data point to help you see the light:
"Containerisation is why a person in Northern Europe who wants to eat strawberries on Christmas day can find them in their supermarket," says John Fossey, a director at industry publication Containerisation International.

"It has been a key enabler of the rapid industrialisation and globalisation we are seeing in the world today."

Indeed, container shipping lines now run so efficiently that it doesn't really matter where you are sourcing products from.

If you look at the transport cost per individual item, it costs about $10 to send a tv set from China to the UK, or 10 cents to deliver a bottle of wine from Australia to America.

"It costs less to ship a container between China and Felixstowe than it does to then send it on the road to Scotland," says Philip Damas, research director at shipping consultancy Drewry.Source
Note that last sentence. If relocalization works the way peak oilers say it does, trade between the coast and interior of England is likely to come to a halt before trade between England and China.

A while back, a fellow named Vexed on peakoil.com brought up an educational example:

My father just bought a 100 lb weight set made in China for my step brother at Wal-Mart. It cost $29.95. What does it cost to ship 100 lbs from China to the US?
Let's follow through on this, and develop some cost estimates.

Working from stats I took from news articles (unfortunately no longer available), we find:

Price to move 2 million barrels of crude from Kuwait to Louisiana by Suez (approx. date Oct. 19, 2004): $6.95 million.

Doing the calculation, this turns out to be $.01/pound.

For container freight, North American, trans-Pacific service: average rate is US$1,547 per 20ft container.

Doing the calculations, and assuming a conservative rating of 17,500kg per container, I come up with $.04/pound.

So, the trans-Pacific shipment costs for Vexed's weight set should be in the neighborhood of $4, which is certainly doable.

But Vexed's example raises an important point. If peak oil is going to erode world trade, it will first begin to exert its effects on products which have a low price/weight ratio.

At $55, I calculate the p/w ratio for crude oil to be $0.18/pound.
Similarly, the p/w for the weight set is $0.30/pound.

The weight set is actually more cost effective to transport than crude oil. After all crude is really heavy, bulky, cheap stuff.

Here's a running table I've been keeping of p/w ratios:

p/w ratio for crude oil ($55/bbl crude): $0.18/lb.
p/w ratio for 100-pound weight set from China at Walmart: $0.30/lb.
p/w ratio for tomato: $1/lb.
p/w ratio for jeans: $25/lb.
p/w ratio for gold: $6500/lb.
p/w ratio for heroin: $250,000/lb.

If we assume that products with low p/w ratios will be relocalized first, we get the paradoxical result that crude oil (of all things) is the most likely product to be relocalized! Welcome to the wacky world of "relocalization".
-- by JD

Tuesday, April 25, 2006

295. THE NUCLEAR CONUNDRUM

One of the problems I have with the peak oil community is its obsession with a near term peak in conventional petroleum. I don't really see this as the main problem because there are other forms of energy which can and will take up the slack, primarily coal and nuclear.

The larger problem, I believe, lies farther in the future, at the point when oil and gas have peaked and become seriously exhausted. So let's take the longer view and assume we're already at that point. Maybe the year is 2050 or 2100 -- pick your own number -- but for all practical purposes, we're very low on oil and gas. What does the world look like?

Some say: No problem, we'll just switch over to coal. But that's screwy. If we're going to switch to coal in the post peak oil/gas period, everybody is going to be switching and sucking down the coal of coal-rich nations (like America and Australia), not just the coal-rich nations themselves. Or, alternatively, the coal-rich nations will be powering their grids and driving on coal, while the rest of the world will be struggling to keep the lights on.

So coal really isn't the long-term answer, and in the end (barring other developments) preservation of the energy status quo will lead us into one of two scenarios:

Scenario 1) A world carpeted with tens of thousands of nuclear power plants. The question here then is security. Clearly the risks of dirty bombs, terrorists acquiring nuclear weapons, accidents due to mismanagement etc. increase greatly in this situation. We could have centralized enrichment and reprocessing/waste management, but then you've got a sprawling logistical network of nuclear/radioactive materials criss-crossing the earth in routine shipments, much like oil does today. Which will clearly increase the risk of theft, terrorist attacks, acts of war etc. A good question to ask here is: When and where will the first dirty bomb be detonated? And whose facility will the radioactive material come from?

On the other hand, you could have localized enrichment and reprocessing. That would eliminate the logistical risk, but introduce the risk of proliferation of nuclear weapons. That doesn't seem like such a good idea either.

In any case, you're going to need a massive worldwide security/emergency-response apparatus to police the situation, and this is an externality whose cost the nuclear power companies themselves should be forced to bear.

Scenario 2) Due to the risks involved in 1), 2nd tier countries are forcibly barred from nuclear development, and thus from electricity. This, however, seems likely to lead to conflict, and surges of refugees into nuclear countries where the power is still reliable. This too will necessitate huge investments in security.
-- by JD

294. WILL A SUPERSPIKE MODERATE DEMAND?

In the peak oil community as a whole it is becoming ever clearer that an enormous amount of technological & sociological options are there to provide us with a sustainable world. The discussion of what level of welfare can be achieved with these options is still ongoing. Everyone that has studied the peak oil issue knows that a large change has to happen to make this a sustainable world, no matter what level of welfare we are talking about.

I think oil prices can be a great help in forcing this change. Only in times of need can the radical changes and re-doing that is necessary take place. The question we need to ask to understand this process is how the oil market will develop. Until now the peak oil crowd has mostly looked at production scenarios from the supply side. Next week on the 27th of April I will discuss future oil price predictions at a conference of the Dutch University of Tilburg. In my presentation I have included the following chart:


What we see in the chart above is the Regular scenario that I made in the Peak Oil Netherlands World Oil Production & Peaking Outlook of 2005 (peak in 2012). This was based on a bottom-up oil projects analysis which has now proven to be slightly on the optimistic side. The actual production at the end of 2005 has been roughly 600.000 barrels per day lower than what I expected. The preliminary conclusion that we can draw from this is that the decline in the world as a whole is somewhat larger, more in the vein of ExxonMobil’s 4% to 6% than Shell’s 2% - 3%. Another option is that geopolitical forces and project slippage are quite big (even the disruptive scenario which tried to account for these factors was a little bit too optimistic).

In any case, should we be worried about this outcome for 2005? That depends on your viewpoint. The second scenario in the chart above, demand influenced, is trying to integrate demand side responses. At the moment I am not that sure how this will all play out. I strongly believe that we are in what Goldman Sachs calls the “superspike” period. Oil prices will go through the roof (100+ dollars) in the coming years due to supply constraints on the geological side but also the investment and refining side. According to the oil project analysis there is enough oil out there to postpone a peak until at least 2010. I realize that this is still under debate, but for the scope of this article I consider a peak before 2010 quite unlikely.

In the media the current price rise is attributed mainly to demand and geopolitical factors. While this is true, the underlying cause is simply that many more oil countries have peaked as of late. In the past five years, nine countries have peaked so far. In the 10 years before that only eight countries peaked. It is safe to say that the decline rate in the world as a whole is increasing. This is what has truly caused a decline in the spare capacity of the world; the increased demand only increased the problem. The chart below shows the years at which either peak or a decline after the plateau period happened for the stated country.

If we assume that superspike will happen in the coming years how will it influence demand? In the most optimistic case everything goes very smoothly. At a certain supply level demand lowers itself to fit into the constraints of supply. That will cause the oil price to equilibrium out at the level of supply at that time. The price will cause additional investments to take place that could provide more oil to the market. This is the basic outline for the “regular” scenario. On the other hand, will the world be such a smooth place in the zero-spare capacity game we are in at the moment? All eyes are focused at Iran at the moment. What will happen to oil production given the nuclear debate and possible intervention? I consider it quite likely that another oil shock takes place, or multiple smaller ones, triggering “superspike”. In this case the demand influence comes into play. The production level I have presented in my scenario is only instrumental to demonstrate this point; it could very well be that production drops firmly for a while due to such a shock.

If such a shock happens, economies will take a blow like in the 70’s, demand drops to come into equilibrium with the new supply situation. However, there is no fall back cushion from the supply side, only a strategic reserve cushion that could help somewhat. You can imagine that the effects could last for quite some time; oil production is not restored that easily and stays on a plateau level. In the beginning, oil prices of near 200 dollars per barrel are a reality, probably moderating after a few months to a year to around 100 dollars a barrel.

This superspike period will be the time when we all the technological & sociological options will be put to the test. If the will to invest and change doesn’t take place in a longer period with very high oil prices, when will it work? In the most optimistic scenario, oil production just keeps on a plateau until it drops off because demand starts to decrease due to the technological and sociological change. The peak presented in the demand influenced scenario can be scrapped from the chart. And peak oil isn’t all that interesting anymore.

In the more realistic scenario, we still keep on demanding gigantic quantities of oil. Since everyone wants to have more of the stuff huge investments take place in oil production capacity to sell at high prices. After a few years, this investment is translated into higher oil production which may moderate oil prices of around 100 dollars a barrel to a lower level, such as 60 dollars a barrel. Than the last spurt takes place to a peak around the end of the next decade, pumping at full tilt until production starts dropping off sharply. The downside curve in the chart may be too optimistic in this case. In any case the continued high prices will be a breaking point to cause change.

Note:

The demand influenced scenario has not been based on any calculations but on a mental framework. The scenario only serves an instrumental purpose. So do the oil prices mentioned in this article, they are wild guesstimates. The website of the discussion at the University of Tilburg is http://www.internationalconference.nl
-- by Rembrandt Koppelaar (Peak Oil Netherlands Foundation)

Sunday, April 23, 2006

293. "BLOOD IN THE STREETS"

Over time, we've seen a gradual shift in the rhetoric of the peak oil community. The original pessimist position was based on "hard", unavoidable numbers and realities: the human population is dependent on oil for food, and as oil declines, this must lead inevitably to mass die-off of most of the world's population. As we have seen, however, this argument is only superficially plausible, and when we dig deeper into it, we find that it is basically a bunch of B.S.

On the whole, even the doomers themselves have grudgingly accepted the refutation of die off theory, and have shifted their focus to economic cataclysm. Their rhetoric is now based on concepts like fiat money, unmanageable debt, recession, depression, inflation, deflation, stagflation, consumer credit, housing bubbles, financial overextension and imbalances etc. etc. It's kind of ironic really. The original doomer position was that economists are wholesale idiots, "flat earthers" who have no credence whatsoever. They were supposed to stay out of the peak oil debate and leave it to geologists -- because economists don't have the expertise to comment on oil depletion. Yet now, we are seeing the peak oilers crassly invading the turf of their enemies (the economists) in order to salvage their collapse scenario. I guess the bottom line on the turf question is that economists have no valid opinions on peak oil because they have no expertise, but peak oiler amateurs have valid opinions on economics because they're... well... peak oilers.

One thing is for sure, though: economic apocalypse is notoriously hard to predict.

Just to give you an example, I recently got an interesting old book from a friend when he moved and threw out all his old paperbacks. It's called "Blood in the Streets: Investment Profits in a World Gone Mad". It was written by two financial commentators/analysts (James Dale Davidson and Sir William Rees-Mogg) in 1988. Here's a quote:
The coming years will be a bad time to be ill-advised. A time fraught with snares for anyone who is unprepared. We could be on the verge of a financial upheaval when blood will, indeed, "run in the streets".
The authors describe in great detail the coming upheaval due to the Latin American debt default, the imminent real estate crash, the end of American supremacy etc. etc.

It's entertaining reading because the authors were 100% wrong about everything. The U.S. didn't go down the toilet in the 1990s. Rather, the country experienced the greatest surge of technology-driven prosperity in its history.

My point is that people have been predicting the implosion of the global financial system for more than 30 years. Davidson and Rees-Mogg made an extremely convincing case for it 20 years ago. Nevertheless, nothing actually happened. In fact, anyone who actually bought into their imminent collapse theory in 1988 got burned.

The warning sign, I think, is the tone of the analysis. Davidson & Rees-Mogg were so sure of themselves, and it's eerily reminiscent of the tone in the peak oil community. Many of the quotes from their 1988 book could have easily been lifted off The Oil Drum or peakoil.com yesterday. That's the problem. The economic future is highly unpredictable and should be addressed by hedging -- not by being sure of yourself, but by questioning yourself. Seriously and toughly asking yourself: Could I be wrong? And if so how? What am I missing? That's what Davidson & Rees-Mogg didn't do and that's why they were so wrong.
-- by JD

Friday, April 21, 2006

292. MATT SIMMONS: NO NEED TO FEAR A RECESSION

Bad news, doomtroop. Now, even Matt Simmons is talking like POD. He says Ghawar and Burgan are screwed, and we're in for shortages, but there's no need to fear a recession, let alone a depression.

Read it and weep:
In Limerick yesterday, an industry expert warned there may be further crude price rises on the way.

Speaking at a conference in the University of Limerick yesterday, Mathew Simmons, an investment banker and expert on global oil reserves, warned that production from giant oil fields in Saudi Arabia and other Gulf states may already have peaked, meaning imminent oil shortages.

[...]

Mr Simmons said, however, that there was no need to fear a recession.

He pointed out that higher oil prices meant more revenue for producing countries, which in turn would help to fuel global growth.


To prove the point, the International Monetary Fund yesterday raised its forecast for global economic growth this year to 4.9pc, the best since 1976.Source
-- by JD

291. NATURAL AIR-CONDITIONING

By accident, my apartment has this strange natural air-conditioning. I noticed it when I first moved here. Every summer when it gets hot, I just open the front and back windows, and an incredible draft blows through. The blow rate is roughly equivalent to the medium setting on my 45 watt fan.

It blows constantly, always in the same direction, and I wondered about it for quite a while. The explanation seems to be this: Out back there's a black asphalt parking lot, which is usually about half full. The air rises off the asphalt, creating a convection current which draws in cool air from the shaded courtyard at the front of the building.

I spoke to some people, and apparently this technique has a long history. The romans used it, and it's a classic motif of middle-eastern architecture -- often enhanced by adding shade, trees and water in the courtyard, and tall convection chimneys.

These ideas are catching on in the architectural community. One example is the Eastgate Center in Harare, Zimbabwe:
Eastgate Center

From an article on the Eastgate design concept called Learning from Termites:
Mick Pearce's Eastgate, a mixed-use office and retailing high-rise built in Harare, Zimbabwe, in 1995, is particularly innovative in the way it responds to issues of sustainability. It is a biomorphic project modeled on a bioclimatic control of a typical termite mound that is to be found in the savannah of the countryside.

[...]

...ventilation running costs for Eastgate are a tenth of those for a comparable air-conditioned building. It uses 35 percent less energy than the average consumption of six other conventional buildings in Harare, and the client has saved $3.5 million on a $36 million building due to the fact that no air-conditioning plant had to be imported.
Another example is Portcullis House in London, an office complex for members of Parliament. It uses no chillers and consumes less than 30% of the energy of a conventionally designed building. Note the convection chimneys:
Portcullis House

Another low-tech scheme:
A plan to use cold water from deep in Lake Ontario as a natural coolant in downtown Toronto, Ontario buildings is a step nearer to reality. The Toronto District Heating Corp., the nonprofit utility behind the plan, has received a large equity investment by Canada’s fourth largest pension fund.

A new corporation, called Enwave, will be formed, to be held jointly by the City of Toronto and a subsidiary of the $36-billion Ontario Municipal Employees Retirement System (OMERS).

The investment by OMERS clears one of the biggest hurdles facing the project, which already has environmental approval from the provincial government.

The $120 million project will draw frigid water from more than 60 metres deep down in Lake Ontario, where it maintains a constant five degrees Celsius year-round. The water will be used to chill the water that presently cools downtown buildings, drastically reducing the amount of electricity needed.

A 2.6 km intake pipeline will be constructed, at an estimated cost of up to $45 million, to draw water from the lake, as well as a distribution pipe in the city's downtown core.

The plan could reduce carbon dioxide emissions by 40,000 tonnes annually and should be in use by 2010.Source
A pdf from the IEA on this topic: Avoiding the need for Active Cooling - The systems/whole building approach
-- by JD

Wednesday, April 19, 2006

290. THE PEAK OILER ARGUMENT FOR RECESSION

In responding to the previous article, diemos trotted out the usual peak oiler argument for recession, and because it is so pervasive, let's give it a closer look.

diemos writes:
Assume prices double but you still have the same amount of money. You and everyone else are now buying half of what you were buying before. Your standard of living goes down.
This assumption is simplistic and has nothing to do with the real world. The current annual inflation rate in the U.S. is about 3.4%, and that's fairly high by recent standards. At that rate, it would take about 20 years for prices to double. In fact, the CPI-U currently stands at 199.8 against a basis number of 100 for 1984 (Source). Which means it has taken 22 years for prices to double. So diemos is essentially asking us to assume that wages and salaries remain constant over the course of decades. That's a bad assumption which we shouldn't grant.

Another important point: Even assuming that things work as diemos says they do above, it's not clear why this would be a problem for, say, oil companies. If the price of oil doubles, and you buy half as much, it has no net effect at all on the oil companies. You're still paying them the same amount of money, which means that their revenues are unaffected by your behavior.

So let's talk about the real situation instead of a fairy tale. I refer you again to the case of Stacey Harper in #180.

Stacey was not faced with a sudden doubling of all prices. She was, however, faced with a doubling of gasoline prices, which she deftly handled by van pooling. This enabled Stacy to reduce her monthly commuting costs from about $190/month to $20/month. Now, it's true that Stacey is buying less gasoline and automobile services than before. But has her standard of living gone down? Let's see what she has to say:
Harper, the South Hill resident, decided to leave her car for a van pool – much to her own surprise.

"I was really resistant to it," she says. "It was going to be a big hassle."

Prices at the pump changed her mind.

She got on a waiting list for a van pool offered by Pierce Transit. She took a driving course. Now she pays $22 a month to van-pool as opposed to the $180 to $200 a month she paid to commute alone.

Even if the price of gas drops below $2, she says, she's not going back.

Part of her reasoning is that she likes to shed the day's stress by talking with her co-workers during the ride home. Part of it is helping the environment by taking a few more cars off the road.

And there's another reason. A big one. "I have extra money," she says.
Isn't that astounding? She actually enjoys van pooling. So how is this a drop in her standard of living? She's getting the exact same functionality (transport from A to B), paying less, and enjoying it more. Where's the "drop"?

You could say the same thing about telecommuting. Gas prices double, so you negotiate a telecommuting contract with your employer to commute half the time. You're getting the same functionality (commuting to work) for half the cost, saving hours and hours of wasted, braindead driving time, and you get to work in the comfort of your own home. You can sleep later. So where's the "drop"?

Same goes for moving closer to your job/shopping. You get from point A to B by bike or foot, so the functionality hasn't changed. You're saving time and money. You're healthier because you're getting exercise. Where's the "drop"?

diemos continues:
The people who made their living providing the stuff that you used to buy but don't any more now have no job and thus no money. They stop buying things and their standard of living REALLY goes down. This is a recession.
There is some truth in this. As Stacey Harper and people like her improve their standard of living by shifting away from car dependence, this does put stress on those employed in car related industries. And it does lead to people being laid off. However, this is a temporary situation, which is largely (if not totally) compensated by rising employment in growing sectors -- i.e. the sectors where Stacey spends her new monthly surplus of $160-180. The people who lose their jobs get a new one. The autoworkers laid off by GM get new jobs, like commissioning wind turbines for GE. The key questions are how smoothly this transition can be achieved, and how many new jobs are created relative to those that are lost.

-- by JD

Tuesday, April 18, 2006

289. MAJOR JOB CREATION DUE TO PEAK OIL

EnergySpin has found some thought-provoking information which deserves a place here.
The global wind industry has never had it so good - our WindEnergy Study 2006 showed that new installation of wind power worldwide will be quadrupled by 2014. That is very good news - not only for the environment, but also for the economy, as the wind industry becomes a job machine. The German Renewable Energies Association (BEE) expects some 500,000 jobs in Germany alone by 2020. That would mean more people employed in this industry in Germany than in the automotive industry.(Source: WindEnergy April 2006 newsletter, from the EWEC)
This supports the view we've discussed before in 209. THE ULTIMATE PEAK OIL HERESY. Who's to say that peak oil will lead to collapse and economic recession/depression? It's very possible that peak oil will lead to massive construction, employment growth and economic boom due to the need to rebuild and retrofit everything.
-- by JD

Monday, April 17, 2006

288. SAVINAR: "I'M JUST SPECULATING"

After you've followed peak oil for a while, you begin to notice how much of their hysteria just blows over. Somebody on the boards posts a doomy prediction, and they all freak out on it for a while like a bunch of monkeys going nuts over a snake in the cage. Then the prediction doesn't pan out so they quietly forget about it and repeat the cycle.

A good example of this is hype about the impending reinstitution of the draft.

As silly as it seems now, Savinar and Ruppert were quite shrill in predicting an imminent military draft back in the old days. I thought I'd call Savinar on that one, so I posted this over at peakoil.com:
Phew boy, that Savinar... He really knows what's GOING DOWN...

Matt Savinar wrote:
Here's how I think the draft will go down:

1. Michael Moore's film helps stir up anti-Saudi sentiment among the general population.

2. House of Saud continues to destabilize.

3. Increased terrorist activity, relating to number two.

4. Need a president to call for a draft? Who better to ask than a Democrat ex-war hero? Just like you needed a Dem to get welfare reform through, you need a Dem to get the draft.

John Kerry has said he will fight the war on terror "better" than Bush!Source
So what happened there, wonderboy? Was there a booger on your crystal ball?
Savinar replied:
If you note, I tend to couch my language (including the above post) in terms like "I think." That implies some degree of speculation as to the details.
So when Savinar tells you "Civilization as we know it will end soon," you might want to remember that Savinar is a green 20-something who is just "speculating". In fact, his grasp of reality is so tenuous that he actually thinks WWIII will be triggered by a Michael Moore movie.
-- by JD

Sunday, April 16, 2006

287. ALBERTA OIL SANDS COMING ON STRONG

A new report by CIBC World Markets in Toronto has some interesting data on the Alberta Oil Sands. Some highlights:
  • By the end of the decade, oil sands will be the leading factor in supply growth, surpassing both conventional oil and deepwater.
  • Alberta will be the world leader in adding new oil production in the next decade, surpassing Saudi Arabia, Brazil, Kazakhstan, Azerbaijan, Angola, Nigeria, Mexico, UAE and the USA.
  • Annual additions to oil sand capacity will increase sharply in the next 5 years: 150,000 bpd in 2006/2007, 300,000bpd in 2008, 400,000bpd in 2009, 500,000 in 2010.
  • In the period 2006-2008, 58% of new capacity will come from non-conventional oil (47% deepwater, 5% Canadian oil sands, 3% gas liquids, 3% other heavy). By 2010, non-conventional (oil sands, deepwater, gas liquids) will account for about 25% of all oil production. (And that still doesn't take into account the other elements of the non-conventional spectrum: ethanol, biodiesel, CTL and GTL.)
  • The report also has a detailed list of new Canadian oil sands projects which are scheduled to come on stream.
It's not really clear where this scale-up is going to end. ASPO seems to think that heavy oil production will top out at 4mbd and continue at that level until 2050 (source: ASPO Newsletter, April 2006):
However, it's not clear why that should be true. The area of the tar sands is vast -- 54,000 square miles, roughly the size of Florida. So there's plenty of room for everybody. True, there may be limitations on natural gas, but we've already seen one compelling work around: nuking the tar sands. In fact this seems to be the idea that wouldn't die. From an April 13, 2006 article in the Calgary Sun:
The province's first nuclear power plant could open in the oilsands within a decade, says a Calgary-based company in talks with several oilpatch players and government officials to bring the project to reality.

"It'll come -- it's just a matter of the date," said Wayne Henuset, director of Energy Alberta Corporation.

So why is it exactly that oil sands production will hit 4mbd in 2015 and then just stop dead in its tracks? I could see growth halting due to the Kyoto Protocol or some other hard limit imposed by the government, but that doesn't seem likely given the public's current level of political activism, and their profound addiction to the private automobile.

There's also an inconsistency between peak oil sources on this topic. ASPO gives a maximum figure of 4mbd for all heavy oil, but (as we saw in 187. FISHY HIRSCH WEDGES) the Hirsch report assumes that heavy oil production in Venezuela alone can be jacked up from 0.6mbd to 6mbd in 10 years as part of a U.S.-driven "crash program" of mitigation.
-- by JD

Saturday, April 15, 2006

286. COAL AND THE EROEI OF CORN ETHANOL

The EROEI of corn (maize) ethanol is one of the "hot button" issues of peak oil, and a source of endless debate. On one side, you've got the partisans of David Pimental who say corn ethanol has an EROEI less than 1, and thus takes more energy to make than it actually contains. On the other side, you've got folks citing a variety studies showing Pimental to be in error.

This debate crops up again and again, and in fact, we had a little outbreak in the comments of this blog the other day.

The topic is boring in the extreme, and guaranteed to give you a migraine headache, so let's save ourselves a lot of time and misery by short-circuiting the entire fruitless argument.

My thesis: The poor EROEI of corn ethanol doesn't matter if you use a cheap, non-liquid form of energy (like coal) to do the distilling and synthesize the fertilizer etc. If you proceed that way, then ethanol can be regarded as a form of "coal liquefaction", and the low EROEI doesn't matter. The question is whether coal liquefaction via ethanol is more cost effective than coal liquefaction via other routes.

It turns out that this is exactly where the future of corn ethanol is going -- a fact I learned from Robert Rapier. Robert is a chemical engineer working in the oil industry, and has an outstanding new blog (R-SQUARED) which I will be adding to the POD sidebar. He is definitely the source to turn to for the best information on biofuels. In a great post on the future of grain ethanol, he describes a number of work-arounds for low EROEI and covers the coal strategy:
The final option is one that most environmentalists probably will not embrace. However, it is the one most likely to take place in the short-term. The natural gas input into ethanol production is a serious long-term threat to economic viability. Since natural gas is a fossil fuel, and supplies are diminishing, it will put upward pressure on the price of ethanol over time. However, if the energy inputs could be produced from coal, ethanol prices would be insulated from escalating natural gas prices. This might also end the EROI debate. I have heard the argument go something like this. "If I have 1 BTU of coal, who cares if I only get back 0.8 BTUs of ethanol? I converted the BTUs into a readily usable liquid form." This argument may be valid from both an economic and EROI point of view, but it ignores the fact that coal is still an inherently dirty energy source. If coal remains abundant and cheap, coal economics will beat natural gas economics, but coal will increase the rate at which we put carbon dioxide into the atmosphere. If we come up with a viable method of sequestering the carbon dioxide produced at the power plant, then we might finally have a viable economic solution (although we are still using up a non-sustainable fuel in the process).Source
Robert also happened to find this article from the Christian Science Monitor which describes how coal-based ethanol is catching on in Iowa. From the article:
Late last year in Goldfield, Iowa, a refinery began pumping out a stream of ethanol, which supporters call the clean, renewable fuel of the future.

There's just one twist: The plant is burning 300 tons of coal a day to turn corn into ethanol - the first US plant of its kind to use coal instead of cleaner natural gas.

An hour south of Goldfield, another coal-fired ethanol plant is under construction in Nevada, Iowa. At least three other such refineries are being built in Montana, North Dakota, and Minnesota.Source
Cleaner options in the same vein include using nuclear or solar process heat.
-- by JD

Friday, April 14, 2006

285. STREET CAR!

Continuing my series* on what the future looks like, I thought you might get a kick out of this real-life street car which I ride sometimes to a friend's house. It's a popular ride here in Osaka, where people call it the "Chin-Chin Densha".

Here the Chin-Chin Densha pulls into the station to get a new load of passengers. Note the pantograph on top. These cars have been around for decades, but they're actually trendy EVs (Electric Vehicles).


Mellow folks riding:


Two EVs passing each other on the street:

Outdated fossil fuel vehicles driving over the tracks:
-----
*)156. BICYCLES IN JAPAN, 144. YOUR BUDDY: THE SPACE HEATER
-- by JD

Thursday, April 13, 2006

284. RENEWABLES PROVIDE A LOT MORE THAN A "TINY" FRACTION OF PRIMARY ENERGY

Hacks and propagandists for the fossil fuel industry are fond of saying that renewables only provide a tiny fraction of our energy needs, and thus are not a viable option for the future.

Here's a classic sample from Lee Raymond, former CEO and Chairman of Exxon:
One of the difficulties people have, even some who work in this business, is understanding the scale and size of the energy industry. This is important to understand in order to put in perspective what some of the alternatives are and to judge if they are significant in the context of the whole. There are many alternative forms of energy that people talk about that may be interesting. But they are not consequential on the scale that will be needed, and they may never have a significant impact on the energy balance. To the extent that people focus too much on that — for example, on solar or wind, even though they are not economic — what they are doing is diverting attention from the real issues. And 25 years from now, even with double-digit growth rates, they will still be less than 1 percent of the energy supplied to meet worldwide demand. I am more interested in staying focused on the 99 percent than the 1 percent.Source
This is a load of self-serving corporate PR bullshit. In fact, renewables provide the vast majority of our energy needs, even today, and can very easily provide much much more at almost no cost. Sound unbelievable? I thought so too, because I was brainwashed just like everybody else. Then Rowan from sydneypeakoil.com turned me on to Hermann Scheer, a German who is a true genius of energy analysis. Scheer has a more correct way of looking at things which I'll explain for you in my own words.

Consider a simple example. Like most people in Japan, I generally dry my laundry by hanging it out the window. This process uses two renewable energy sources: wind and solar. In the U.S., on the other hand, most people use electric or gas dryers which consume about 1000kwh/year/dryer (about 6% of power consumption in the average household).

The odd thing here is that, when an American dries their clothes with non-renewable energy, the electricity and gas is included in the energy statistics. But when I dry my clothes with renewable energy, the solar and wind isn't included in the statistics. So it's no big surprise that renewables account for a tiny fraction of primary energy. Whenever you use renewables, the statistics don't count it!

If everybody in the U.S. started drying their clothes on the line, or using a laundry rack, you'd have an immediate gain of about 30GWh in renewable energy "production". And it's not like there is a problem with "scaling" or bad economics here. The cost of switching to renewable clothes drying is about $20. The payback time on your investment in a clothesline/rack is about a month.

And that's just the tip of the iceberg. Another obvious example is Africa. Most energy needs in Sub-Saharan Africa are met with renewable solar and biomass, but that somehow doesn't count as "real energy". That's because it's only real when Lee Raymond and his country club* cronies make money on it.

Here's some more examples from Scheer's book The Solar Economy:
Heating needs met from solar collectors or from wood burning stoves, houses positioned for maximum solar gain, conservatories, transparent insulation, double glazing, exploitation of the heat input from the human bodies living or working in the building, heat exchangers, exploitation of none of these solar heating gains find their way into the energy statistics.

Further examples: people need artificial light from sunset to sunrise; during the daytime, the sun meets lighting needs. The need for artificial light is lower when the days are long than when the days are short. The difference in electricity demand between these two times of year is an indication of the proportion of lighting needs that is met by the sun.

These energy inputs are ignored because they are taken for granted, yet they are of great practical importance. These is considerable scope for energy conservation through using town planning to maximize solar gain, and through architectural features and additional 'daylighting' technology that allows a maximum amount of daylight into the building. Nevertheless energy statistics take no account of energy-conscious planning and design. The same can be said for the replacement of cooling systems powered by diesel motors or grid electricity with natural cooling and flexible shading.

The inadequacy of energy statistics also extends to the figures for electricity consumption: what does not flow through the grid does not get counted. Not a single form of autonomous energy generation is recognized in the energy statistics! Yet the range of autonomous systems extends from wristwathes to pocket calculators, from water pumps to autonomous houses with no grid connection, from solar lamps to street signs lit using PV, from solar battery charges to the solar home systems in developing country villages and small-scale wind turbines. This list could be extended indefinitely, both for heating and for electricity. It includes sun-dried crops, irrigation windmills, biological fertilizers, cycling, solar-powered boats and more many more examples of how fossil fuel consumption can be avoided or replaced.

[...]

These blind spots mean that energy statistics oriented toward commercial piped energy can only provide a fragmentary and thus wholly inadequate understanding of energy. They obscure the fact that, notwithstanding massive consumption of fossil fuel and nuclear energy, the sun is still humankind's largest single energy source.

[...]

With current data-collection practices, theoretically it would be possible to replace more than half of all fossil energy consumption with solar technology without significantly increasing the statistically observable proportion of energy demand met from renewable sources. (P. 141-143)
So this whole bit about renewables making up only a tiny fraction of the energy pie is nothing but accounting chicanery -- just what you'd expect from the greedy, polluting scumbags who run Exxon.

Kinda makes you want to do a lab-rat experiment on Lee Raymond. We place Lee in a world without energy supplied by the sun and the wind. Just switch the sun off, and let Lee take care of business with fossil fuels from Exxon. As the food shrivels and the temperature plummets, Lee shouldn't have much trouble. After all, the sun and the wind are just small-scale, insignificant energy sources which "may never have a significant impact on the energy balance".
-----
*) When I say "country club", I do mean country club:
A proxy statement filed by Exxon with the Securities and Exchange Commission on Wednesday disclosed that the former chairman Lee Raymond received a compensation package worth about $140 million last year, including cash, stock, options and a pension plan. He is also still entitled to stock, options and long-term compensation worth at least another $258 million.

The total sum paid to Raymond amounts to at least $398 million and is among the biggest US compensation bonanzas ever. [...]

Exxon's board also agreed to pay Raymond's country club fees, allow him to use the company aircraft and pay him another $1 million to stay on as a consultant for another year. Mr. Raymond agreed to reimburse Exxon partly when he uses the company jet for personal travel.

[...]

The company [Exxon] also paid $210,800 for Mr. Raymond's country club fees, financial planning and tax assistance services. It also provided two years of protection for Raymond and his wife, including paying for a security system for his principal residence, security personnel, a car and a driver.Source

Lee Raymond, poster boy for disgusting rich people

Yes, if you hear anything coming out of Lee's grotesque oral cavity, you can be pretty sure it's just the greed talking.
-- by JD

Wednesday, April 12, 2006

283. LAHERRERE MORPHING INTO ODELL?

Looking at Laherrere's liquids forecast in the previous entry (#282), I couldn't help but notice the striking similarity to some old charts from the uber-cornucopian economist Peter Odell.

First, take a look at the peak oil forecast from Campbell & Laherrere's 1998 Scientific American article:

According to the caption in the article, the red line indicates conventional + unconventional oil. Note that the graph tops out prior to 2005 at a global production level of about 26Gb/year = 71mbd. This was substantially in error because the world is currently producing about 85mbd.

Now let's contrast this with Laherrere's most recent 2006 chart (referenced in the previous entry):

What a difference 8 years makes, eh? In the new chart, conventional + unconventional tops out around the year 2020 at 92mbd. Interestingly, Laherrere not only includes the likely case (unconventional = 1Tb) but also an "unlikely" case (unconventional = 2Tb). This is clearly a hedge. If 2Tb was truly unlikely, why even put it in the chart? It's almost as though he's toying with possibility of an unexpectedly large flow of unconventional oil.

Now compare Laherrere's new chart with this chart from a 2000 paper* by Peter Odell:

Isn't that resemblance striking? Laherrere starts out in 1998 with no secondary unconventional hump. In 2006, he commits to a little mini-hump (the purple dashed line indicating 1Tb of unconventional). But, at the same time, he hedges his bets with an "unlikely" full-size secondary hump (the orange dotted line indicating 2Tb of unconventional). And this "unlikely" hump sits side-by-side with the conventional hump, just like in Odell's 2000 paper! Laherrere seems to be slowly inching his way into the chilly waters of cornucopianism.

------
*) This paper "The Global Energy Market in the Long Term: The Continuing Dominance of Affordable Non-Renewable Resources" has been removed by the site which formerly hosted it, and can only be found now in the Google cache. If you're interested, you should download it before it disappears. It is located here.
------
-- by JD

Tuesday, April 11, 2006

282. LAHERRERE: LIQUIDS WILL PEAK AROUND 2020

To his great credit as a scientist, Jean Laherrere has accepted the common-sense criticism that liquids are what matters, not the irrelevant cult-object subset of liquids which Colin Campbell calls "Regular Conventional Oil" (see #43, #52 and #230) . Laherrere now accepts that biomass liquids and synthetic oil from coal are a form of "oil" and must be counted as such if we are to face reality.

Laherrere's latest forecast (from the recent EGU meeting in Vienna):
I have access to several technical databases.
Liquids production will significantly decline after a likely bumpy plateau 2010-2020 and likely chaotic oil prices.
30 years from now, production of easy oil will be 35% less than to day but production of all liquids (including from coal and biomass) only 5% less than to day.
So much for the near-term peak and deadly decline everyone's been hyping (unless, of course, somebody got to Laherrere and he's now "on the payroll"... LOL.)

5% down in 2030... Yup, that should give you plenty of time to get that rustic doomer hide-out you foolishly purchased up and running. Have fun cleaning out the barn for the next 25 years!! If you get tired, and want to know who to pin the blame on, click here.

Moving on... here's Laherrere's chart for all liquids. Note the URR of 3Tb likely, 4Tb possible (click graphs to enlarge):
And, for all you Hubbert-Linearization true-believers, here's Laherrere's new liquids linearization. Note how the linearization goes haywire after 2003. We were all set to hit 2250, and then Bing! the unexpected happens, and now we're heading for 3000 -- maybe even 4000. Which just goes to show how completely worthless HL is as a predictive technique:
-- by JD

281. MORE ON FLOW BATTERIES

In #274, I briefly discussed flow batteries, and provided a link to Jim Fraser's explanation of how they operate. These batteries are capable of storing huge amounts of energy -- on the order of hundreds of MWh (enough energy to power 100,000 ordinary homes for a few hours).

A new article from the Toronto Star provides some details on the cost effectiveness of flow batteries compared to gas peaking plants:
While flow batteries are not new, the first dating back to the 19th century, interest has grown since the 1970s, and especially recently as they have become commercially viable for large-scale applications. They currently sell for approximately $500 per kWh of storage capacity, with incremental storage costs in large-scale systems of only $150 per kWh. In comparison, the cost of the 550 MW Portlands Energy Centre [a gas peaking plant] is projected to be $700 million.

Installation costs are difficult to compare, as generator size is measured in megawatts (MW) while batteries are measured in megawatt-hours (MWh). The installation cost of a generator, to be compared to a battery, would have to take into account the number of hours it is expected to operate. If the Portlands Energy Centre served a daily peak of five hours duration, installation would cost $255 for each daily kWh it produced. Installation of a five-hour flow battery would cost $220 per kWh. Working lifetimes of the systems are comparable.

Operating and maintenance costs of flow batteries are dramatically lower than those of gas-fired generation, at a tenth of a penny per kWh. The system operates automatically. The "fuel" for flow batteries is inexpensive energy purchased off-peak at about 3 cents per kWh. With energy losses of 25 to 30 per cent, total costs for delivery are about 4 cents per kWh.

Gas-fired generation, by contrast, fluctuates around 7 cents per kWh just for the fuel to produce it, with much higher operating and maintenance costs that can bring the total cost to 10 cents per kWh produced.
Flow batteries also have other advantages relative to gas peaking plants: short construction periods, zero emissions, low noise, few moving parts and smaller site footprint.

These batteries are a great idea, and in fact, may actually be too great of an idea. If they catch on, they're bound to step on the toes of the existing Big Gas industry and all the fat cats and speculators who've invested in gas futures and LNG. Now that every greedy scumbag around is positioned to profiteer on skyrocketing gas prices, the last thing they want to see is some slick, simple technology which slashes demand for gas.

In fact, it's very possible that the entrenched gas/utility industry has actually stepped in to derail the development of flow batteries. In the early 2000s, the Tennessee Valley Authority (TVA) was constructing a 120MWh flow battery in Columbus, Mississippi...
Developed as the Regenesys Project with the Tennessee Valley Authority and partly funded by the U.S. Department of Energy, the project generated tremendous interest through 2003. A 120 MWh peak system was to provide the power for 7,500 homes for 10 hours each day.

The project reached the point where electrolyte was being brought in. But when the energy company developing the process was purchased by a German firm, the project was suddenly halted.(Source: Toronto Star article)
From an AP report:
Posted on Tue, Dec. 09, 2003
Company pulls plug on power storage plant in Lowndes County
Associated Press

COLUMBUS, Miss. - Seven months after halting construction of a cutting edge, large-scale power storage plant here, Regenesys Technology Ltd. has pulled the plug on the $25 million Lowndes County project.

The company will no longer manufacture the technology needed to run the 12-megawatt plant that was being built off Mississippi 373 near Columbus Air Force Base.

Mark Kuntz, Regenesys' vice president of marketing and business development for U.S. operations, said German utility company RWE purchased its parent company, Innogy Technology Ventures Limited of Great Britain, and wishes to stop funding the technology.

"Upon review of overall strategy, the parent company decided that Regenesys Technology is not part of their core operation," Kuntz said.Source
Further info from the Guardian:
Innogy pulls plug on Regenesys
Tuesday December 16, 2003
The Guardian

Innogy, the energy group, has abandoned its Regenesys electricity storage project after its German parent, RWE, decided against investing the money needed to commercialise the technology.

"The whole project has stopped. Following a European-wide review of core projects, the decision was taken not to commit further funding to the Regenesys electricity storage scheme," a spokesman said yesterday. "While ongoing testing has proven the technology, we will not be committing the capital expenditure needed to take it to market," he added. (Source: same as above)
A similar 120MWh battery in Little Barford (UK) was almost complete when it was axed by the new owners (more information here). Here's a photo of the abandoned facility from the Google cache:
-- by JD

Sunday, April 09, 2006

280. ANOTHER DEBUNKER EMERGES

Toby Hemenway is a permaculturist who has written a good piece called "Apocalypse, Not" debunking peak oil hysteria. This has been widely discussed, but it certainly deserves a place here:
There is no doubt that oil is running out. But to believe that it will surely bring the end of the world, you must believe that:
  1. Our demand for oil is unchangeable and is not significantly affected by price.
  2. We are so badly addicted to oil that we will watch our civilization collapse rather than change our behavior.
  3. Significant oil conservation is not possible in the time frame
  4. Even with conservation, demand will be more than oil plus alternatives can possibly meet.
  5. Society is so fragile that it cannot withstand large shocks.
These are the significant beliefs needed to be a Peak Oil catastrophist. Each is false. Let's look at them.
I'll refer you to the article for specifics on these five points. However, Hemenway does raise an interesting, little-discussed point about the Hubbert curve (click image for a clearer view):

Hubbert’s US peak prediction was accurate, and the decline initially followed his curve. It has lately deviated significantly (see Figure 1, above)

[...]

Let’s engage in a little critical thinking about Hubbert’s curve. Domestic oil production began to fall sharply around 1970. Why the steep drop? If we’re blinded by theory, we’d say “because supply dried up” and leave it at that. But a careful thinker must look for other explanations that may have an effect. There are several: A major oil spill off California in 1969, the first Earth Day in 1970, and many other events spawned a rise in environmental consciousness in the 1970s, and soon, public outcry forced the US to block off-shore drilling and other sources of domestic oil because they damaged our environment. The 1973 Arab oil embargo sent prices skyward, and Americans bought small cars and turned down thermostats, squelching demand and thus domestic production. And, the 1960s and 1970s saw both the rise of the multinational corporation and Britain’s retreat from its Middle-Eastern colonies, a combination that encouraged the oil majors to abandon US oilfields and to enormously boost Mideast operations, where regulations were lax, labor cheap, and supplies huge.

Thus the sharp fall in US production, while affected by the depletion of some easy-to-drill domestic deposits, had many other causes. Today, lapsed US oil leases are being bought back by the oil majors, who are developing these deposits with new techniques. Congress has re-authorized off-shore drilling, and US production has stopped falling. We’re not on Hubbert’s curve any more.
This is a thought-provoking idea. How much of the U.S. decline after 1970 was due to geological constraints, and how much was due to political constraints, and the easier availability of oil elsewhere?
-- by JD

Thursday, April 06, 2006

279. THE MANY WRONG PREDICTIONS OF KEN DEFFEYES

In the interests of honesty and full-disclosure, it's probably best if we take a close look at the numerous failed peak predictions of Professor Kenneth Deffeyes, PhD.

Ken first called the peak for the year 2000. In an article called "Brace yourself for the end of cheap oil" in New Scientist*, Deffeyes had this to say:
And he [Deffeyes] believes the highest single year may already have passed. "2000 may stand as a blip above the curve and be in the Guinness Book of World Records."
Similar remarks are recorded in the ASPO August 2003 newsletter:
This may substantiate the view, voiced by Ken Deffeyes, at the Paris ASPO Meeting [May 2003], that peak oil production may turn out to have been in 2000 as much from falling demand as supply constraints.
This was a huge goof, and seriously calls into question Deffeyes grasp of the situation. According to the EIA, oil production in 2000 was 77mbd, while today it is pushing 85mbd.

Next, in his book "Hubbert's Peak", published in 2001, Deffeyes claimed that "the numbers" showed that peak would occur in 2003, although he admitted the possibility of error, as described in the review of his book in the October 2001 issue of Scientific American:
The numbers pointed to 2003 as the year of peak production, but because estimates of global reserves are inexact, Deffeyes settled on a range from 2004 to 2008. Three things could upset Deffeyes's prediction. One would be the discovery of huge new oil deposits. A second would be the development of drilling technology that could squeeze more oil from known reserves. And a third would be a steep rise in oil prices, which would make it profitable to recover even the most stubbornly buried oil.
Then, in the New Scientist article* referenced earlier, Deffeyes made the following claim:
I am 99 per cent confident that 2004 will be the top of the mathematically smoothed curve of oil production.
This too, turned out wrong. Production kept rising, so Deffeyes swept the old predictions under the carpet, and boldly stated that the peak would occur on Thanksgiving Day (Nov. 24) 2005.

Yet again, his prediction turned out wrong, so he changed his prediction to Dec. 16, 2005.
In the January 2004 Current Events on this web site, I predicted that world oil production would peak on Thanksgiving Day, November 24, 2005. In hindsight, that prediction was in error by three weeks. An update using the 2005 data shows that we passed the peak on December 16, 2005.Source
(This waffle occurred in the same issue of his web newsletter where he claimed that "By 2025, we're going to be back in the Stone Age" -- a claim that he later backpedaled and retracted. See 259. KEN DEFFEYES STARTS BACKPEDALING.)

This still isn't the end of it. Just a few days ago a reader of this blog attended the EGU meeting in Vienna. In a "Great Debate" with Jean Laherrere, Michael Lynch and Yves Mathieu, Deffeyes said that if we consider the uncertainty of his regression line, peak oil can be expected to occur somewhere between Nov. 2005 and April 2006 -- i.e. right now. In other words, he's waffling yet again.

So let's total up the whole sorry scorecard. Deffeyes has predicted that PO would occur in:

2000
2003
2004-2008
2004
Nov. 24 2005
Dec. 16 2005
And now Nov. 2005-April 2006.

No integrity whatsoever. Just a sad old man trying to hang onto the spotlight. Maybe it's time to retire, Ken, and open a waffle shop.

You wanna know the method that Ken is using to predict the peak now? It's fun. Anybody can do it, and it's guaranteed to work -- even if you're a drooling moron with Cheetos in your nostrils.
  1. Buzz over to the EIA site, and see what the current world oil production figure (X) is.
  2. State that X is the peak.
  3. If in fact X does turn out to be the peak, you're Prophet El Supremo.
  4. If oil production subsequently rises, you'll have to "readjust your prediction to take account of new data". Go to step 1.
Deffeyes isn't the only scammer out there playing this game. T. Boone Pickens is running the same con, and making money at it!

“Never again will we pump more than 82 million barrels.”
-- T. Boone Pickens, 9th August 2004. On the Kudlow and Cramer Show, MSNBC.
Source

“Global oil [production] is 84 million barrels [per day]. I don't believe you can get it any more than 84 million barrels."
-- T. Boone Pickens, addressing the 11th National Clean Cities conference in May 2005.
Source

"I don't believe that you can increase the supply beyond 84 or 85 million barrel as day."
-- T. Boone Pickens, on "CNN In the Money", June 25, 2005.
Source

"Supply is—you‘ve just about had it on supply; 85 million barrels a day world supply is about it. "
-- T. Boone Pickens, on Hardball with Chris Matthews, MSNBC, Aug. 26, 2005
Source

------

*) New Scientist vol 179 issue 2406 - 02 August 2003, page 9 -- a copy can be downloaded as a doc file here),
-- by JD

Wednesday, April 05, 2006

278. ZERO ENERGY HOMES

Expanding on Rembrandt's excellent post about the future of housing, I'm going to continue digging into new (and old!) techniques for energy self-sufficient housing. This is an important topic because we often hear bloated doomer estimates of how much gas, coal and nuclear we're going to need to keep our civilization afloat. If housing can be retrofit and redesigned to minimize/eliminate the need for electricity and heating fuels, we're going to be well on our way to a bright future.

The DOE (U.S. Department of Energy) has a great website packed with information on energy efficiency. I'll be exploring this site further in upcoming posts, but today I would like to discuss some experiments the DOE has done on "Zero Energy Homes".

Now, the term "Zero Energy Home" (ZEH) is a bit of a marketing term, and does not necessarily mean a home requiring zero grid energy. It is, however, a very good start, as can be seen in the pdf "On the Path to Zero Energy Homes". This pdf describes research conducted by the DOE in Florida in 1998 using a ZEH and a control home:

The ZEH has a variety of efficiency features, both in terms of architecture and equipment: a 3-foot roof overhang for better shading, a reflective white-tile roof, better outer wall insulation, interior-mounted ducts which don't pass through the hot attic, solar control windows, high-efficiency appliances and lighting, programmable thermostat, solar water heating system, downsized air-conditioner and a 4kW PV (PhotoVoltaic) solar panel array.

In testing, the ZEH performed nicely:
When all the numbers were in, the Zero Energy home performed extremely well. The results for June 18, 1998—a day with the hottest daytime temperatures ever recorded in Lakeland, Florida—tell the story. During a 24-hour period, the Zero Energy home used 72% less power from air-conditioning than did the control home, despite the fact that the occupied Zero Energy home maintained cooler indoor temperatures.
Here's the graph (the original itself is a little blurry):

The yellow line indicates electrical demand of the control house; the red line indicates power produced by the solar array of the ZEH; and the blue line indicates net electrical demand of the ZEH. As you can see, there were numerous times -- during the hottest day on record in Lakeland, Florida -- when the ZEH was supplying electricity to the grid, not taking electricity from it.

This is very interesting for two reasons:
  1. It shows that Jim Kunstler's gleeful forecasts about the death of Phoenix/Las Vegas due to lack of air-conditioning are unfounded hype.
  2. More broadly, it shows how we can greatly reduce -- and maybe even eliminate -- the need for fossil/nuclear power plants, as well as centrally distributed fuel oil and NG. And if we can do that we're going to free up a sh*t load of fuel and nuclear capacity for more important tasks.
So here's the question for all you engineers, architects, visionaries and arm-chair experts out there: Is it possible, in principle, to design a true Zero Energy Home -- an affordable, comfortable home which requires no external fossil/electrical energy inputs at all? Let's get to work!!
--by JD

Tuesday, April 04, 2006

277. WHY A MASSIVE POPULATION IS GOOD

I think a hundred years from now the ideal population, contrary to current trendy thinking, would not be a small population but a massive one. Far more massive then most people imagine being possible. The more humans the better things will be.

*Pause for pessimists to roll their eyes*

I'll attempt to explain this seemingly bizarre concept.

Paul wrote:
> If there were less people it would be nicer now, because we would have destroyed
> less on the way here...

If there were less people, it would not be now. If the current world population had only just reached what it was in the nineteen twenties for example, we wouldn't be at the technological and social stage that we are currently at, but rather that of the nineteen twenties. This is because growing populations and growing economies is what drives development and progress.


There seems to be this notion that if the human population somehow stayed at the miniscule levels of the pre-industrial era, then we could have advanced to some glorious age of high technological and socio-political existence, yet also had abundant resources for all.

This notion is garbage.

If the human population did not expand humanity would still be living in the pre-industrial hell that many people foolishly romanticize. It's through population and economic expansion that progress and development is made. The reason we live such comfortable, healthy, educated and entertained lives today is because of the large human population.

And so back to my opening statement, the ideal human population of the future is a massive population. Because if there is a massive human population in the future it will mean that we have continued to progress, develop, and evolve. A progressing population in the years ahead will solve many of the problems we now face. A growing population will have found alternative ways to live and prosper; they will have found ways to undo much of the environmental damage done on the journey; they will have found sustainable ways to live and ways to raise the standard of living.

Contrary to doomer shortsighted thinking, a large population will be far better for both humanity and the environment then a small population can ever be.
-- by Omnitir

Monday, April 03, 2006

276. ECONOMIC GROWTH WITH FLAT FOSSIL FUEL CONSUMPTION

One of the central beliefs of peak oil is that flat or declining consumption of fossil fuels will cause economic growth to halt and decline.

Oddly enough, DOE statistics show that -- at least in the case of personal gasoline and natural gas consumption -- this was not true in the U.S. for the 20 year period from 1981 to 2001.

Per capita oil consumption for transportation was flat:
Per capita residential consumption of natural gas declined:
Meanwhile, the real GDP doubled (click for a clearer picture):

And the DOW rose from 947 in Jan. 1981 to 10788 in Dec. 2000 -- an increase of about 11.4 times (1040%). With no increase in per capita consumption of oil for transportation, or residential natural gas.

-----

Thanks to Paul and dub_scratch, who caught me doing some of my usual monkey business in this post. They are right that a better comparison is with real GDP per capita, given in the following Table:

As you can see, the point holds true. Real GDP per capita grew by 50% from 1981 to 2001.

More broadly, this shows that increasing real GDP (both gross and per capita) and increasing stock prices are perfectly compatible with zero growth in personal driving, and decreasing use of natural gas in the home.
-- by JD

Sunday, April 02, 2006

275. THE FUTURE OF HOUSING

A large part of the peak oil crowd is stuck inside a narrow minded way of thinking. They focus on oil and politics. Not looking at initiatives that are now small, but financially attractive. One of these is an idea that emerged in the minds of a man called Albert Veerman from Holland, only 2.5 years ago. To build a house from expanded polystyrene (EPS) foam, a widely used packaging and insulation material. The idea was formed when he was demolishing his house and discovered that EPS is far stronger than stones.

Since that time he has worked together with the Technical University of Delft to build a house from this material, compliant with European building standards. He started a building company (Veerhuis Bouwsystemen BV). In 2005 the first house has arisen in a small town called Volendam. It has a metal framework (can also be wood or concrete) to carry the construction. This framework is totally encapsulated with a 30 cm thick wall of EPS. Unto this wall a special layer of “veerman mortar” is placed to make the building weather and fire resistant. The floor also is built with special insulation materials. The foundation of the house is made with a material called stelconplaten in Dutch.

Veerman House

This simple idea has a truly amazing amount of advantages:
  1. Due to the super efficient design, this house saves 50% to 60% of the energy in comparison to conventional brick houses. The Dutch use an energy performance coefficient (EPC) which is a measure for the efficiency of a building. The average house in the Netherlands should have a coefficient of 0,8 since 1 January 2006. The EPS house has a coefficient of 0,3! The heating of the house comes from a unit that is so small that it can fit in a small backpack. The prototype in Volendam was even built so that the heating unit can be removed!
  2. The building costs are far cheaper due to the simple design; the EPS house costs 30% to 45% to build than conventional houses. One of the causes is the simple method in which EPS can be adapted to any form you want, just by using heat instead of drilling in bricks.
  3. This easiness makes the time to construct a house very short. The house in Volendam was built within six weeks. The design can be mass manufactured, pre-fabricated style. If mass manufactured the building time would only take two weeks.
  4. The building is compliant with all European building standards. Although the lightness of the material would suggest a storm hazard this is not the case. The house weighs 18 to 30 tons; it is totally weatherproof and can withstand a storm at wind strength ten. The Dutch institute TNO has extensively tested the building; it has a fire resistance of more than 90 minutes. Although some may think that the house will not be very strong, this is not the case. You can easily put very heavy things on your wall, no problem at all.
  5. This lightness is one of its strengths. It can be moved to another location very easily. A floating design to combat rising seas is on the drawing board.
  6. The sustainability is amazing. EPS is a plastic that only degrades due to UV-radiation. Thanks to the plaster and mortar on the outside this does not happen. In principal this house can last eternally. And even if destroyed around 80% of the materials can be recycled.
This invention has already been patented in the European Union. The next step will be to build 180 houses in Bruinisse and Krommenie, two other Dutch villages. The Spanish and Turks are already interested in building such houses. Especially in Turkey since the EPS house can be built to be earthquake resistant. Not long from now, the world will probably be filled with these houses. Think about the possibilities. You can even take your house with you when you take a job in another town.

[A pdf flyer on the Veerman design (in Dutch) is available here.]
-- by Rembrandt Koppelaar

274. FLOW BATTERIES

Flow batteries are a game-changing development which I learned about from Jim Fraser over at the Energy Blog -- the best energy R&D blog on the web. From Jim's article:
Flow batteries are emerging energy storage devices that can serve many purposes in energy delivery systems. They can respond within milliseconds and deliver power for hours. They operate much like a conventional battery, storing and releasing energy through a reversible electrochemical reaction with an almost limitless number of charging and discharging cycles. They differ from a conventional battery in two ways 1) the reaction occurs between two electrolytes, rather than between an electrolyte and an electrode and 2) they store the two electrolytes external to the battery and the electrolytes are circulated through the cell stack as required. The great advantage that this system provides is the almost unlimited electrical storage capacity (MWh), the limitation being only the capacity of the electrolyte storage reservoirs.
This is a new technique for storing large amounts of power which can be used in a distributed fashion (i.e. in individual buildings or facilities), or as a large scale substitute for pumped storage or CAES (compressed air energy storage). The only limitation on the amount of power the batteries can store is the size of the tanks storing the electrolytes. This is another technology which promises to make intermittent sources like wind and solar much more practical. I'll refer you to Jim's excellent explanation for the details.
-- by JD